Journals > > Topics > Medical Optics and Biotechnology
Medical Optics and Biotechnology|220 Article(s)
Digital Breast Tomography Reconstruction Based on Focusing Layer Separation from Multi-Angle X Ray Projections Using Blind Source Separation
Chunyu Yu, Mingrui Liu, and Ningning Sun
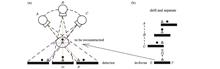
ObjectiveBreast cancer ranks first in female malignant tumors and seriously threatens the life and health of women. However, early diagnosis and treatment can effectively prolong the life of patients. Digital breast tomosynthesis (DBT) is a new three-dimensional imaging technology employed for breast disease diagnosis and scans within a small angle range and reconstructs breast tomography images by collecting a few low-dose projections at equal angle intervals. Compared to computed tomography (CT), it is more suitable for conducting imaging on special human parts such as the breasts that are not easy to scan at large angles and feature low-dose and low-cost imaging. Hologic Selenia Dimensions is a DBT product first certified by the Food and Drug Administration (FDA) in 2011, followed by DBT products from several companies such as GE, Siemens, and Fujifilm. The reconstruction method of DBT plays a vital role in its imaging quality, and currently, the main methods are based on shift and add (SAA) reconstruction, and analytic reconstruction (AR) and iterative reconstruction (IR) methods derived from electronic CT. Among them, SAA calculates the mean of multi-angle projection based on the displacement shift to enhance the information of the focusing plane and weaken the information of the non-focusing plane. However, it is rarely utilized due to the severe out-of-plane interference in the reconstrution slice. Filtered back projection (FBP) is a representative method of the AR class, which makes image details clearer by projection filtering. In particular, the fast reconstruction speed and stable numerical values make it suitable for medical diagnosis. Therefore, it is currently selected as a commercial method. However, FBP can cause serious artifacts and noise in limited-angle scanning DBT, which is unfavorable for breast disease diagnosis. The maximum likelihood expectation maximization (MLEM) method is considered the best reconstruction method in the IR class, providing a good balance between the high- and low-frequency parts of the image. However, the IR method has a longer running time and is difficult to apply in clinical practice before improving the reconstruction speed. Therefore, we seek a DBT reconstruction method that can reduce reconstruction artifacts and improve reconstruction speed. The multi-angle projection is divided into multiple observation vectors, and the BSS technology is adopted to extract the focusing information for reconstructing the focusing plane.MethodsWe propose to adopt blind source separation (BSS) to separate any focusing information from multi-angle projections. First, multi-angle projections are collected by DBT imaging machine, and logarithmic transformation is performed on these projections. Then, based on the central projection, the multi-angle projections are focused on the reconstrution slice at depth z via the displacement according to the imaging geometry. Finally, the multi-angle projections after displacement are regarded as a group of linear combinations composed of the focusing information and a lot of outer information. Meanwhile, by selecting a weight-adjusted second order blind identification (WASOBI) that is efficient in separating observation signals with temporal structures, the focusing plane information is extracted from multi-angle projections, and external interference, such as noise and artifacts, is separated. By shifting the multi-angle projection to any depth z, all slices within the thickness range are reconstructed.Results and DiscussionsThe focusing information is separated using BSS to quickly reconstruct any slice within the breast thickness range. By taking central projections as a reference, SAA, FBP, and MLEM are compared with the proposed method. All these four improve the original in reducing noise by 13.4%, 18.8%, 88.5%, and 73.6%, and reduce image contrast (IC) by 83.7%, 81.4%, 74.6%, and 10.7%, respectively. Feature similarity index measure (FSIM) of the reconstrution slice and the central projection is 0.841, 0.866, 0.861, and 0.886, respectively, and the structural similarity index measure (SSIM) is 0.596, 0.594, 0.628, and 0.787, respectively. Additionally, the mean value (MV) of artifact diffusion is 0.571, 0.254, 0.189, and 0.146, respectively. The reconstruction speed of the proposed method is lower than that of SAA and FBP, but it is 56.0% higher than that of MLEM with two iterations. The reconstruction method BSFP is based on BSS, which regards the obtained multi-angle projection as a linear combination of information within a focusing plane and several kinds of information outside the slice at depth z. Then, the focusing information is separated using WASOBI, which is sensitive to temporal observation signals in the BSS, to reconstruct the focusing information. A comparison of the three DBT reconstruction methods, SAA, MLEM, and FBP, shows that BSFP has less residual out-of-plane information, such as artifacts in the reconstrution slice. This is because BSS has a strong separation and filtering effect on out-of-plane interference while separating the reconstruction, which leads to a stronger sense of hierarchy and clearer details in the reconstruction slice. Due to its filtering processing, FBP has higher clarity in its reconstrution slice compared to SAA and MLEM. SAA is equivalent to a simple BP method without filtering. If the filtering processing is added during the reconstruction, the reconstruction results will be similar to SAA, while if filtering is added during the MLEM reconstruction, its contrast will also be improved. The small metal balls which have simple structures are taken as the object to study the artifacts in reconstruction. However, when the object shape is complex, complicated flaky artifacts will be formed, and the artifacts in the SAA, MLEM, and FBP reconstrution slices are more likely to connect into flakes, which can cause severe image blurring. Therefore, it can be concluded that to eliminate external interference in the BSFP reconstrution slice, we can choose effective methods, such as more effective filtering before reconstruction, setting multi-projection weights based on the imaging geometry, correcting the displacement shift formula in the three-dimensional direction based on the imaging geometry irradiated by cone beam rays, and taking into account the small swing angle of the DBT detector.ConclusionsOur DBT reconstruction method BSFP can improve the original image in reducing noise by 73.6% and improve contrast-to-noise ratio (CNR) by 137.2%. Meanwhile, its reconstruction speed is lower than that of SAA and FBP but is 56.0% higher than that of MLEM with two iterations. This method features sound performance in image noise reduction, detail preservation, artifact suppression, and reconstruction speed. It can continuously improve the separation and reconstruction performance with the rapid development of BSS theory and computer hardware. Therefore, it is a practical and promising DBT reconstruction method. Since the separation accuracy of the focusing information depends on the BSS establishment, the operational efficiency of BSFP depends on the selection and optimization of the BSS method. Additionally, the operational speed of BSFP heavily depends on the hardware environment. Therefore, windowing operations, method optimization, code simplification, and utilization of graphics processing unit (GPU) can all improve the BSFP performance. ObjectiveBreast cancer ranks first in female malignant tumors and seriously threatens the life and health of women. However, early diagnosis and treatment can effectively prolong the life of patients. Digital breast tomosynthesis (DBT) is a new three-dimensional imaging technology employed for breast disease diagnosis and scans within a small angle range and reconstructs breast tomography images by collecting a few low-dose projections at equal angle intervals. Compared to computed tomography (CT), it is more suitable for conducting imaging on special human parts such as the breasts that are not easy to scan at large angles and feature low-dose and low-cost imaging. Hologic Selenia Dimensions is a DBT product first certified by the Food and Drug Administration (FDA) in 2011, followed by DBT products from several companies such as GE, Siemens, and Fujifilm. The reconstruction method of DBT plays a vital role in its imaging quality, and currently, the main methods are based on shift and add (SAA) reconstruction, and analytic reconstruction (AR) and iterative reconstruction (IR) methods derived from electronic CT. Among them, SAA calculates the mean of multi-angle projection based on the displacement shift to enhance the information of the focusing plane and weaken the information of the non-focusing plane. However, it is rarely utilized due to the severe out-of-plane interference in the reconstrution slice. Filtered back projection (FBP) is a representative method of the AR class, which makes image details clearer by projection filtering. In particular, the fast reconstruction speed and stable numerical values make it suitable for medical diagnosis. Therefore, it is currently selected as a commercial method. However, FBP can cause serious artifacts and noise in limited-angle scanning DBT, which is unfavorable for breast disease diagnosis. The maximum likelihood expectation maximization (MLEM) method is considered the best reconstruction method in the IR class, providing a good balance between the high- and low-frequency parts of the image. However, the IR method has a longer running time and is difficult to apply in clinical practice before improving the reconstruction speed. Therefore, we seek a DBT reconstruction method that can reduce reconstruction artifacts and improve reconstruction speed. The multi-angle projection is divided into multiple observation vectors, and the BSS technology is adopted to extract the focusing information for reconstructing the focusing plane.MethodsWe propose to adopt blind source separation (BSS) to separate any focusing information from multi-angle projections. First, multi-angle projections are collected by DBT imaging machine, and logarithmic transformation is performed on these projections. Then, based on the central projection, the multi-angle projections are focused on the reconstrution slice at depth z via the displacement according to the imaging geometry. Finally, the multi-angle projections after displacement are regarded as a group of linear combinations composed of the focusing information and a lot of outer information. Meanwhile, by selecting a weight-adjusted second order blind identification (WASOBI) that is efficient in separating observation signals with temporal structures, the focusing plane information is extracted from multi-angle projections, and external interference, such as noise and artifacts, is separated. By shifting the multi-angle projection to any depth z, all slices within the thickness range are reconstructed.Results and DiscussionsThe focusing information is separated using BSS to quickly reconstruct any slice within the breast thickness range. By taking central projections as a reference, SAA, FBP, and MLEM are compared with the proposed method. All these four improve the original in reducing noise by 13.4%, 18.8%, 88.5%, and 73.6%, and reduce image contrast (IC) by 83.7%, 81.4%, 74.6%, and 10.7%, respectively. Feature similarity index measure (FSIM) of the reconstrution slice and the central projection is 0.841, 0.866, 0.861, and 0.886, respectively, and the structural similarity index measure (SSIM) is 0.596, 0.594, 0.628, and 0.787, respectively. Additionally, the mean value (MV) of artifact diffusion is 0.571, 0.254, 0.189, and 0.146, respectively. The reconstruction speed of the proposed method is lower than that of SAA and FBP, but it is 56.0% higher than that of MLEM with two iterations. The reconstruction method BSFP is based on BSS, which regards the obtained multi-angle projection as a linear combination of information within a focusing plane and several kinds of information outside the slice at depth z. Then, the focusing information is separated using WASOBI, which is sensitive to temporal observation signals in the BSS, to reconstruct the focusing information. A comparison of the three DBT reconstruction methods, SAA, MLEM, and FBP, shows that BSFP has less residual out-of-plane information, such as artifacts in the reconstrution slice. This is because BSS has a strong separation and filtering effect on out-of-plane interference while separating the reconstruction, which leads to a stronger sense of hierarchy and clearer details in the reconstruction slice. Due to its filtering processing, FBP has higher clarity in its reconstrution slice compared to SAA and MLEM. SAA is equivalent to a simple BP method without filtering. If the filtering processing is added during the reconstruction, the reconstruction results will be similar to SAA, while if filtering is added during the MLEM reconstruction, its contrast will also be improved. The small metal balls which have simple structures are taken as the object to study the artifacts in reconstruction. However, when the object shape is complex, complicated flaky artifacts will be formed, and the artifacts in the SAA, MLEM, and FBP reconstrution slices are more likely to connect into flakes, which can cause severe image blurring. Therefore, it can be concluded that to eliminate external interference in the BSFP reconstrution slice, we can choose effective methods, such as more effective filtering before reconstruction, setting multi-projection weights based on the imaging geometry, correcting the displacement shift formula in the three-dimensional direction based on the imaging geometry irradiated by cone beam rays, and taking into account the small swing angle of the DBT detector.ConclusionsOur DBT reconstruction method BSFP can improve the original image in reducing noise by 73.6% and improve contrast-to-noise ratio (CNR) by 137.2%. Meanwhile, its reconstruction speed is lower than that of SAA and FBP but is 56.0% higher than that of MLEM with two iterations. This method features sound performance in image noise reduction, detail preservation, artifact suppression, and reconstruction speed. It can continuously improve the separation and reconstruction performance with the rapid development of BSS theory and computer hardware. Therefore, it is a practical and promising DBT reconstruction method. Since the separation accuracy of the focusing information depends on the BSS establishment, the operational efficiency of BSFP depends on the selection and optimization of the BSS method. Additionally, the operational speed of BSFP heavily depends on the hardware environment. Therefore, windowing operations, method optimization, code simplification, and utilization of graphics processing unit (GPU) can all improve the BSFP performance.
Acta Optica Sinica
- Publication Date: Apr. 25, 2024
- Vol. 44, Issue 8, 0817001 (2024)

Online Detection System of Human Exhaled Nitric Oxide Based on TDLAS Technology
Weijie He, Juncheng Lu, Lu Gao, Qiong Wu, Xiaoyu Wu, Huagui Nie, Xiaojing Chen, and Jie Shao
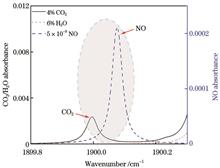
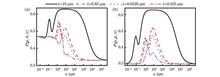
ObjectiveIn recent years, death and economic losses caused by respiratory diseases have occurred globally, with a significant portion of respiratory disease patients facing challenges related to delayed early detection and inadequate treatment in later stages. With the advancing medical technology, numerous studies have demonstrated a close association between the volume fraction of human fractional exhaled nitric oxide (FeNO) and respiratory disease. In normal individuals, airway epithelial cells produce a small amount of nitric oxide (NO), with volume fractions generally below 2.5×10⁻⁸. However, in patients with respiratory diseases, inflammatory cells in the airways produce a large amount of NO, with volume fractions generally 2-10 times higher than those in normal individuals. FeNO detection is a non-invasive, simple, rapid, and efficient method for exhaled breath diagnosis. It can be employed to differentiate respiratory diseases with similar clinical presentations, such as asthma, chronic obstructive pulmonary disease (COPD), and overlapping syndromes. Additionally, it can predict treatment outcomes and post-treatment management for patients with these conditions. FeNO detection provides information that cannot be obtained from medical history, physical examinations, and lung function tests alone, and it contributes to improving the diagnosis and treatment of respiratory diseases, elevating the clinical management of respiratory diseases to a new height.MethodsFor FeNO detection, we utilize tunable diode laser absorption spectroscopy (TDLAS) technology, which is known for its high sensitivity, precision, and fast response rate. The fundamental theory of TDLAS is based on Beer-Lambert's law that when light passes through a certain volume fraction of gas, gas molecules absorb light at specific wavelengths. The relationship between the emitted light intensity and incident light intensity can be directly adopted to establish the relationship between the signal magnitude and gas molecule volume fraction. Direct absorption spectroscopy (DAS) directly applies this law. Due to the susceptibility of DAS to low-frequency noise such as interference fringes, wavelength modulation spectroscopy (WMS) is a commonly adopted method to suppress low-frequency noise. The basic principle of a WMS involves the combination of a low-frequency triangular wave signal and a high-frequency sine wave signal generated by a signal generator. These signals are introduced into the laser to drive both scanning and modulation of the laser wavelength, and the laser is directed into the gas absorption cell, interacting with gas molecules. The detector receives the laser light after the interaction and converts the optical signal into an electrical signal, and the lock-in amplifier demodulates it into a harmonic signal. The relationship between the harmonic signal and gas molecule volume fraction is established by gas calibration.Results and DiscussionsWe calibrate the exhaled carbon dioxide (CO2) volume fraction within a single exhalation cycle using both DAS and WMS (Figs. 4 and 5). By simulating the second harmonic signals of mixed gases of CO2 and NO, we determine correlation coefficients to achieve the inversion of FeNO volume fraction (Figs. 6 and 7). By a 15-minute continuous measurement of the volume fraction changes of mixed gases of CO2 and NO, and Allan variance curve analysis, the system's CO2 gas measurement precision and detection limit are determined to be 0.045% and 5.4×10⁻³ [Figs. 8(a) and 10(a)] respectively. For NO, the measurement precision and detection limit are found to be 1.1×10⁻⁹ and 3.4×10⁻⁹ [Figs. 8(b) and 10(b)], respectively. By repeatedly replacing mixed gases of CO2 and NO with nitrogen (N2) and measuring the gas volume fraction changes over time, the system's response time is determined to be 12 s (Fig. 9). Finally, based on the gas curve during a single exhalation cycle at an exhalation flow rate of 3 L/min, the volume fractions of CO2 and NO in the exhaled breath of 18 volunteers are determined (Figs. 11 and 12).ConclusionsWe establish a FeNO detection system based on TDLAS, with the selected target absorption line for NO at a wavenumber of 1900.07 cm-1. Experimentation is conducted with NO at a volume fraction of 4.76×10⁻⁶ under a pressure of 0.3 atm, and 46 mV is chosen as the optimal modulation amplitude. DAS and WMS are adopted to calibrate the CO2 volume fraction. By simulating the second harmonic signals, we calculate the relationship between the signals of CO2 and NO, completing NO volume fraction calibration. Precision, response time, and stability of both CO2 and NO are analyzed to evaluate the system performance. Through Allan variance analysis, within an integration time of 25 s, the system's detection limits for CO2 and NO are determined to be 5.4×10⁻³ and 3.4×10⁻⁹ respectively. Finally, an analysis of different stages of the complete exhalation cycle in adults is conducted to calculate the concentrations of CO2 and NO, and 18 volunteer samples are processed and analyzed. Experimental results demonstrate the feasibility of using a mid-infrared quantum cascade laser (QCL) for low-concentration measurement of NO, providing references for real-time online detection of human exhaled gases. ObjectiveIn recent years, death and economic losses caused by respiratory diseases have occurred globally, with a significant portion of respiratory disease patients facing challenges related to delayed early detection and inadequate treatment in later stages. With the advancing medical technology, numerous studies have demonstrated a close association between the volume fraction of human fractional exhaled nitric oxide (FeNO) and respiratory disease. In normal individuals, airway epithelial cells produce a small amount of nitric oxide (NO), with volume fractions generally below 2.5×10⁻⁸. However, in patients with respiratory diseases, inflammatory cells in the airways produce a large amount of NO, with volume fractions generally 2-10 times higher than those in normal individuals. FeNO detection is a non-invasive, simple, rapid, and efficient method for exhaled breath diagnosis. It can be employed to differentiate respiratory diseases with similar clinical presentations, such as asthma, chronic obstructive pulmonary disease (COPD), and overlapping syndromes. Additionally, it can predict treatment outcomes and post-treatment management for patients with these conditions. FeNO detection provides information that cannot be obtained from medical history, physical examinations, and lung function tests alone, and it contributes to improving the diagnosis and treatment of respiratory diseases, elevating the clinical management of respiratory diseases to a new height.MethodsFor FeNO detection, we utilize tunable diode laser absorption spectroscopy (TDLAS) technology, which is known for its high sensitivity, precision, and fast response rate. The fundamental theory of TDLAS is based on Beer-Lambert's law that when light passes through a certain volume fraction of gas, gas molecules absorb light at specific wavelengths. The relationship between the emitted light intensity and incident light intensity can be directly adopted to establish the relationship between the signal magnitude and gas molecule volume fraction. Direct absorption spectroscopy (DAS) directly applies this law. Due to the susceptibility of DAS to low-frequency noise such as interference fringes, wavelength modulation spectroscopy (WMS) is a commonly adopted method to suppress low-frequency noise. The basic principle of a WMS involves the combination of a low-frequency triangular wave signal and a high-frequency sine wave signal generated by a signal generator. These signals are introduced into the laser to drive both scanning and modulation of the laser wavelength, and the laser is directed into the gas absorption cell, interacting with gas molecules. The detector receives the laser light after the interaction and converts the optical signal into an electrical signal, and the lock-in amplifier demodulates it into a harmonic signal. The relationship between the harmonic signal and gas molecule volume fraction is established by gas calibration.Results and DiscussionsWe calibrate the exhaled carbon dioxide (CO2) volume fraction within a single exhalation cycle using both DAS and WMS (Figs. 4 and 5). By simulating the second harmonic signals of mixed gases of CO2 and NO, we determine correlation coefficients to achieve the inversion of FeNO volume fraction (Figs. 6 and 7). By a 15-minute continuous measurement of the volume fraction changes of mixed gases of CO2 and NO, and Allan variance curve analysis, the system's CO2 gas measurement precision and detection limit are determined to be 0.045% and 5.4×10⁻³ [Figs. 8(a) and 10(a)] respectively. For NO, the measurement precision and detection limit are found to be 1.1×10⁻⁹ and 3.4×10⁻⁹ [Figs. 8(b) and 10(b)], respectively. By repeatedly replacing mixed gases of CO2 and NO with nitrogen (N2) and measuring the gas volume fraction changes over time, the system's response time is determined to be 12 s (Fig. 9). Finally, based on the gas curve during a single exhalation cycle at an exhalation flow rate of 3 L/min, the volume fractions of CO2 and NO in the exhaled breath of 18 volunteers are determined (Figs. 11 and 12).ConclusionsWe establish a FeNO detection system based on TDLAS, with the selected target absorption line for NO at a wavenumber of 1900.07 cm-1. Experimentation is conducted with NO at a volume fraction of 4.76×10⁻⁶ under a pressure of 0.3 atm, and 46 mV is chosen as the optimal modulation amplitude. DAS and WMS are adopted to calibrate the CO2 volume fraction. By simulating the second harmonic signals, we calculate the relationship between the signals of CO2 and NO, completing NO volume fraction calibration. Precision, response time, and stability of both CO2 and NO are analyzed to evaluate the system performance. Through Allan variance analysis, within an integration time of 25 s, the system's detection limits for CO2 and NO are determined to be 5.4×10⁻³ and 3.4×10⁻⁹ respectively. Finally, an analysis of different stages of the complete exhalation cycle in adults is conducted to calculate the concentrations of CO2 and NO, and 18 volunteer samples are processed and analyzed. Experimental results demonstrate the feasibility of using a mid-infrared quantum cascade laser (QCL) for low-concentration measurement of NO, providing references for real-time online detection of human exhaled gases.
Acta Optica Sinica
- Publication Date: Mar. 10, 2024
- Vol. 44, Issue 5, 0517002 (2024)
Split-Spectrum Threshold Decorrelation Optical Coherence Tomography Angiography Method Based on Local Signal-to-Noise Ratio
Lutong Wang, Yi Wang, Yushuai Xu, Shiliang Lou, Huaiyu Cai, and Xiaodong Chen
ObjectiveIn optical coherence tomography angiography (OCTA), the applications of decorrelation mapping, primarily reliant on intensity data, have caught significant attention. However, this method is particularly vulnerable to the deleterious effects of noise, especially in fields characterized by low signal-to-noise ratios (SNRs). Noise artifacts have a pronounced effect on static tissue signals, which makes them exhibit elevated decorrelation between frames and in turn tends to overlap with the high decorrelation values associated with blood flow signals. This overlap detrimentally affects the quality of microvascular image acquisition. Meanwhile, classical techniques for refining decorrelation mapping, such as frequency-domain decorrelation angiography, still struggle to yield optimal results due to this inherent challenge. In response to the spurious static voxel artifacts, some studies have resorted to employing thresholding to eliminate static voxels falling below a predefined threshold. However, the global and indiscriminate nature of such thresholding often lacks a robust theoretical foundation, making the precise suppression of static voxel artifacts a complex endeavor. To this end, we present a novel OCTA approach that incorporates considerations of SNR and dynamic threshold adjustments. This innovative method is further combined with spectral analysis principles to provide a more precise means for the identification and suppression of static voxels. The ultimate objective is to enhance the microvascular imaging quality, thereby serving as a more dependable foundation for medical diagnostics.MethodsWe introduce a method for spectral amplitude decorrelation, which features dynamic threshold adjustments based on local SNRs. The methodology commences with an in-depth exploration of the complex relationship between local image SNRs and static voxels, including a comprehensive analysis of the various factors influencing this association. Subsequently, spectral analysis techniques are employed to mitigate artifacts arising from axial motion and accentuate the visualization of blood flow data. Built upon the established connection between local image SNRs and static voxels, our approach proposes adaptive thresholds for each voxel to ensure precise differentiation between dynamic and static voxels. Voxels exhibiting decorrelation values below the established threshold are categorized as static ones and subsequently suppressed. Conversely, voxels surpassing the threshold are identified as dynamic ones and are retained. Meanwhile, we further employ a sigmoid function to apply non-linear mapping to all voxels, thereby facilitating a seamless transition at the boundary between dynamic and static voxels. After the suppression of static voxels, an averaging process is applied to the decorrelation images, which allows us to reconstruct enface microvascular images by the mean projection technique. Additionally, we have established a dedicated posterior segment SS-OCT system to collect retinal data from volunteers. The effectiveness of our algorithm is rigorously validated via the data, and we conduct comparative experiments with other classical intensity-based OCTA methods to comprehensively assess its performance.Results and DiscussionsIn comparison to the conventional decorrelation mapping approach, the retinal blood flow cross-sectional images processed by our algorithm exhibit prominent blood flow signals, whereas the conventional method's results are largely submerged within the noise emanating from static tissue (Fig. 6). This disparity highlights that the SSADA algorithm affected by noise-induced interference in individual spectral amplitude decorrelation images produces lower-quality enface microvascular images after averaging. In contrast, our algorithm effectively suppresses the noise arising from static voxels within individual spectral amplitude decorrelation images, ultimately yielding high-quality enface microvascular images. Compared to other intensity-based OCTA techniques, our proposed algorithm demonstrates superior performance across both high SNR skin data and low SNR retinal data, with the same preprocessing, target extraction, and image registration protocols employed. For skin data, the enface microvascular images obtained by our algorithm exhibit an SNR enhancement of approximately 4 dB in contrast to the SSADA method without static voxel suppression (Fig. 5). In the case of retinal data, our algorithm produces enface microvascular images with significantly improved contrast ratio, achieving a contrast enhancement of 0.0182 compared to the SSADA method without static suppression (Table 1).ConclusionsWe conduct a systematic examination of the intricate relationship between local SNRs and the decorrelation values of static voxels in OCT structural images. The results show that as noise levels on voxels increase, static voxels exhibit higher decorrelation values. Based on this pivotal finding, we introduce a dynamic threshold adjustment method within the context of spectral analysis. This combined approach adeptly leverages the sensitivity of decorrelation mapping to subtle differences and the efficacy of spectral analysis in mitigating artifacts stemming from axial motion. The retinal enface microvascular images produced by our algorithm adeptly differentiate capillaries in proximity to the macular region, underscoring the algorithm's competence in effectively suppressing static voxel noise within microvascular images. Furthermore, our algorithm consistently delivers favorable outcomes in retinal data characterized by low SNRs, resulting in enhanced image contrast ratio and superior vessel visibility. This enhancement has great potential in improving disease diagnosis and evaluation, contributing to more precise medical assessments. ObjectiveIn optical coherence tomography angiography (OCTA), the applications of decorrelation mapping, primarily reliant on intensity data, have caught significant attention. However, this method is particularly vulnerable to the deleterious effects of noise, especially in fields characterized by low signal-to-noise ratios (SNRs). Noise artifacts have a pronounced effect on static tissue signals, which makes them exhibit elevated decorrelation between frames and in turn tends to overlap with the high decorrelation values associated with blood flow signals. This overlap detrimentally affects the quality of microvascular image acquisition. Meanwhile, classical techniques for refining decorrelation mapping, such as frequency-domain decorrelation angiography, still struggle to yield optimal results due to this inherent challenge. In response to the spurious static voxel artifacts, some studies have resorted to employing thresholding to eliminate static voxels falling below a predefined threshold. However, the global and indiscriminate nature of such thresholding often lacks a robust theoretical foundation, making the precise suppression of static voxel artifacts a complex endeavor. To this end, we present a novel OCTA approach that incorporates considerations of SNR and dynamic threshold adjustments. This innovative method is further combined with spectral analysis principles to provide a more precise means for the identification and suppression of static voxels. The ultimate objective is to enhance the microvascular imaging quality, thereby serving as a more dependable foundation for medical diagnostics.MethodsWe introduce a method for spectral amplitude decorrelation, which features dynamic threshold adjustments based on local SNRs. The methodology commences with an in-depth exploration of the complex relationship between local image SNRs and static voxels, including a comprehensive analysis of the various factors influencing this association. Subsequently, spectral analysis techniques are employed to mitigate artifacts arising from axial motion and accentuate the visualization of blood flow data. Built upon the established connection between local image SNRs and static voxels, our approach proposes adaptive thresholds for each voxel to ensure precise differentiation between dynamic and static voxels. Voxels exhibiting decorrelation values below the established threshold are categorized as static ones and subsequently suppressed. Conversely, voxels surpassing the threshold are identified as dynamic ones and are retained. Meanwhile, we further employ a sigmoid function to apply non-linear mapping to all voxels, thereby facilitating a seamless transition at the boundary between dynamic and static voxels. After the suppression of static voxels, an averaging process is applied to the decorrelation images, which allows us to reconstruct enface microvascular images by the mean projection technique. Additionally, we have established a dedicated posterior segment SS-OCT system to collect retinal data from volunteers. The effectiveness of our algorithm is rigorously validated via the data, and we conduct comparative experiments with other classical intensity-based OCTA methods to comprehensively assess its performance.Results and DiscussionsIn comparison to the conventional decorrelation mapping approach, the retinal blood flow cross-sectional images processed by our algorithm exhibit prominent blood flow signals, whereas the conventional method's results are largely submerged within the noise emanating from static tissue (Fig. 6). This disparity highlights that the SSADA algorithm affected by noise-induced interference in individual spectral amplitude decorrelation images produces lower-quality enface microvascular images after averaging. In contrast, our algorithm effectively suppresses the noise arising from static voxels within individual spectral amplitude decorrelation images, ultimately yielding high-quality enface microvascular images. Compared to other intensity-based OCTA techniques, our proposed algorithm demonstrates superior performance across both high SNR skin data and low SNR retinal data, with the same preprocessing, target extraction, and image registration protocols employed. For skin data, the enface microvascular images obtained by our algorithm exhibit an SNR enhancement of approximately 4 dB in contrast to the SSADA method without static voxel suppression (Fig. 5). In the case of retinal data, our algorithm produces enface microvascular images with significantly improved contrast ratio, achieving a contrast enhancement of 0.0182 compared to the SSADA method without static suppression (Table 1).ConclusionsWe conduct a systematic examination of the intricate relationship between local SNRs and the decorrelation values of static voxels in OCT structural images. The results show that as noise levels on voxels increase, static voxels exhibit higher decorrelation values. Based on this pivotal finding, we introduce a dynamic threshold adjustment method within the context of spectral analysis. This combined approach adeptly leverages the sensitivity of decorrelation mapping to subtle differences and the efficacy of spectral analysis in mitigating artifacts stemming from axial motion. The retinal enface microvascular images produced by our algorithm adeptly differentiate capillaries in proximity to the macular region, underscoring the algorithm's competence in effectively suppressing static voxel noise within microvascular images. Furthermore, our algorithm consistently delivers favorable outcomes in retinal data characterized by low SNRs, resulting in enhanced image contrast ratio and superior vessel visibility. This enhancement has great potential in improving disease diagnosis and evaluation, contributing to more precise medical assessments.
Acta Optica Sinica
- Publication Date: Mar. 10, 2024
- Vol. 44, Issue 5, 0517001 (2024)
Absorption Coefficient Measurement of Turbid Media Based on Acousto-Optical Tomography
Yao Liu, Shiyi Qin, Chang Zhang, Lina Liu, and Lili Zhu
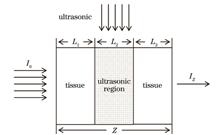
ObjectiveThe physiological state of human tissues and the lesions of tissues are found to be closely related to the optical properties of tissues. The accurate measurement of optical parameters of tissue determines optical diagnosis correctness and phototherapy effectiveness, which is particularly essential in medical applications. At present, the common methods for measuring the optical parameters of biological tissues are integrating sphere technique, diffusion optical tomography, fluorescence imaging, and optical coherence tomography. In these methods, the measurement depth is not deep enough, or the measurement accuracy is not good enough to meet the practical applications. Acousto-optical tomography (AOT) combines the high spatial resolution of ultrasound with the high sensitivity of optical detection to provide excellent imaging depth (cm) at high imaging resolution (submm). AOT employs the localization and modulation of focused ultrasound, and the localization and quantitative measurement of the absorption coefficient of turbid media can be realized. Finally, the limitation that other measurement methods cannot consider both measurement depth and measurement accuracy can be compensated. We obtain the quantitative relationship between the absorption coefficient of the turbid medium and the acoustic-optical signal by theoretical analysis and COMSOL simulation. Furthermore, the absorption coefficient of turbid medium is measured by the AOT experiment, which preliminarily verifies the feasibility of AOT in the measurement of the tissue absorption coefficient.MethodsBased on the radiation transmission theory and the intensity modulation mechanism of acousto-optic interaction in a turbid medium, the analytical relationship between acousto-optic signals and medium optical parameters is obtained. The finite element simulation software COMSOL Multiphysics is adopted for simulation, the extrapolated boundary equation and diffusion approximation theory are utilized to define the light field, and the ultrasound theory is to define the sound field. Meanwhile, the multi-physics field coupling is performed based on an intensity modulation mechanism, and an experimental system of AOT is built to measure the absorption coefficient of a turbid medium.Results and DiscussionsIn the COMSOL simulation, the intensity of the acousto-optic signal increases linearly with the rising incident light intensity (Fig. 5), and the relative intensity of the acousto-optic signal (the ratio of the acousto-optic signal intensity to the incident light intensity) decreases exponentially with the growing absorption coefficient (Fig. 6). The absorption coefficient calculated by simulation is very close to the actual set value. The maximum absolute error is 0.049 cm-1, the minimum absolute error is 0.0074 cm-1, the mean absolute error is 0.026 cm-1, and the detection correlation coefficient is greater than 0.95 (Fig. 7). In the experiment, acousto-optic imaging is performed on samples with different absorption coefficients. When only the incident light intensity is changed, the acousto-optic signal and the incident light intensity show a linear growth relationship (Fig. 10). When the other conditions remain unchanged, the relative intensity of the acousto-optic signal decreases exponentially as the absorption coefficient increases (Fig. 11). The experimental results are consistent with the simulation results. The average absolute error is 0.047 cm-1 and the average relative error is 6.5% when the absorption coefficient is measured for a tissue simulation sample with a thickness of 10 mm (Fig. 12).ConclusionsThe relationship between tissue absorption coefficient and the acousto-optic signal is analyzed theoretically by combining the radiation transmission theory of light propagating in tissue and the intensity modulation mechanism of acousto-optic interaction in turbid media. The relative value of acousto-optic signals is determined by ultrasound parameters (sound pressure, sound frequency, sound speed) and tissue parameters (thickness, optical parameters), and is independent of the incident light intensity. The relative value of the acousto-optic signal decays exponentially with the absorption coefficient of the medium when other conditions remain unchanged. The theoretical results are in good agreement with COMSOL simulations. The maximum relative error of the absorption coefficient measured in the COMSOL simulation is less than 8%. The experimental measurements are carried out using the AOT system, and the experimental results are basically consistent with the simulation results. In the experiment, the maximum absolute measurement of the absorption coefficient of the tissue simulation sample with a thickness of 10 mm is 0.082 cm-1, and the maximum relative error is 9.3%, which initially verifies the quantitative measurement feasibility of the absorption coefficient of the turbid media by AOT. AOT combines the advantages of optical and acoustic technology to measure the absorption coefficient of deep tissue. For example, by combining with a multi-wavelength light source, the absorption coefficient of blood vessels at different wavelengths can be obtained to measure their blood oxygen saturation and thus provide more references for the early diagnosis of some tumors. At present, the main problem of AOT is that the acousto-optic signals are weak with a low signal-to-noise ratio. It is a great challenge for detection instruments and detection methods to extract weak acousto-optic signals from strong background light, and it is also the key and difficult problem that AOT must solve in the future. ObjectiveThe physiological state of human tissues and the lesions of tissues are found to be closely related to the optical properties of tissues. The accurate measurement of optical parameters of tissue determines optical diagnosis correctness and phototherapy effectiveness, which is particularly essential in medical applications. At present, the common methods for measuring the optical parameters of biological tissues are integrating sphere technique, diffusion optical tomography, fluorescence imaging, and optical coherence tomography. In these methods, the measurement depth is not deep enough, or the measurement accuracy is not good enough to meet the practical applications. Acousto-optical tomography (AOT) combines the high spatial resolution of ultrasound with the high sensitivity of optical detection to provide excellent imaging depth (cm) at high imaging resolution (submm). AOT employs the localization and modulation of focused ultrasound, and the localization and quantitative measurement of the absorption coefficient of turbid media can be realized. Finally, the limitation that other measurement methods cannot consider both measurement depth and measurement accuracy can be compensated. We obtain the quantitative relationship between the absorption coefficient of the turbid medium and the acoustic-optical signal by theoretical analysis and COMSOL simulation. Furthermore, the absorption coefficient of turbid medium is measured by the AOT experiment, which preliminarily verifies the feasibility of AOT in the measurement of the tissue absorption coefficient.MethodsBased on the radiation transmission theory and the intensity modulation mechanism of acousto-optic interaction in a turbid medium, the analytical relationship between acousto-optic signals and medium optical parameters is obtained. The finite element simulation software COMSOL Multiphysics is adopted for simulation, the extrapolated boundary equation and diffusion approximation theory are utilized to define the light field, and the ultrasound theory is to define the sound field. Meanwhile, the multi-physics field coupling is performed based on an intensity modulation mechanism, and an experimental system of AOT is built to measure the absorption coefficient of a turbid medium.Results and DiscussionsIn the COMSOL simulation, the intensity of the acousto-optic signal increases linearly with the rising incident light intensity (Fig. 5), and the relative intensity of the acousto-optic signal (the ratio of the acousto-optic signal intensity to the incident light intensity) decreases exponentially with the growing absorption coefficient (Fig. 6). The absorption coefficient calculated by simulation is very close to the actual set value. The maximum absolute error is 0.049 cm-1, the minimum absolute error is 0.0074 cm-1, the mean absolute error is 0.026 cm-1, and the detection correlation coefficient is greater than 0.95 (Fig. 7). In the experiment, acousto-optic imaging is performed on samples with different absorption coefficients. When only the incident light intensity is changed, the acousto-optic signal and the incident light intensity show a linear growth relationship (Fig. 10). When the other conditions remain unchanged, the relative intensity of the acousto-optic signal decreases exponentially as the absorption coefficient increases (Fig. 11). The experimental results are consistent with the simulation results. The average absolute error is 0.047 cm-1 and the average relative error is 6.5% when the absorption coefficient is measured for a tissue simulation sample with a thickness of 10 mm (Fig. 12).ConclusionsThe relationship between tissue absorption coefficient and the acousto-optic signal is analyzed theoretically by combining the radiation transmission theory of light propagating in tissue and the intensity modulation mechanism of acousto-optic interaction in turbid media. The relative value of acousto-optic signals is determined by ultrasound parameters (sound pressure, sound frequency, sound speed) and tissue parameters (thickness, optical parameters), and is independent of the incident light intensity. The relative value of the acousto-optic signal decays exponentially with the absorption coefficient of the medium when other conditions remain unchanged. The theoretical results are in good agreement with COMSOL simulations. The maximum relative error of the absorption coefficient measured in the COMSOL simulation is less than 8%. The experimental measurements are carried out using the AOT system, and the experimental results are basically consistent with the simulation results. In the experiment, the maximum absolute measurement of the absorption coefficient of the tissue simulation sample with a thickness of 10 mm is 0.082 cm-1, and the maximum relative error is 9.3%, which initially verifies the quantitative measurement feasibility of the absorption coefficient of the turbid media by AOT. AOT combines the advantages of optical and acoustic technology to measure the absorption coefficient of deep tissue. For example, by combining with a multi-wavelength light source, the absorption coefficient of blood vessels at different wavelengths can be obtained to measure their blood oxygen saturation and thus provide more references for the early diagnosis of some tumors. At present, the main problem of AOT is that the acousto-optic signals are weak with a low signal-to-noise ratio. It is a great challenge for detection instruments and detection methods to extract weak acousto-optic signals from strong background light, and it is also the key and difficult problem that AOT must solve in the future.
Acta Optica Sinica
- Publication Date: Feb. 25, 2024
- Vol. 44, Issue 4, 0417001 (2024)
Polarization Properties of Partially Coherent Circular Edge Dislocation Beams in Biological Tissue
Gaimei He, Meiling Duan, Ziang Yin, Jing Shan, and Jiaojiao Feng
ObjectiveDue to the rapid development of laser optics, the application of optical methods in photoacoustics, photoacoustic imaging, biomedicine photonics, and other fields has received widespread attention presently. As is known, it is significant to study the propagation behaviors of lasers in biological tissue to understand the interaction mechanism between the laser and biological tissue. Up to now, a large number of researchers have studied the polarization behavior of laser beams propagating through different media, such as ocean turbulence, atmospheric turbulence, and free space. In addition, the circular edge dislocation beam belongs to a typical singular beam with a circular notch in the transverse plane along the transmission direction, which undergoes a π mutation in the phase across the notch (dislocation line), and the basic research about the polarization state of circular edge dislocation beams in biological tissue transmission has not been reported yet. In order to promote the application of singularity optics in biomedical disease diagnosis and treatment and the development of tissue imaging technology, the basic research on the polarization behavior of circular edge dislocation beams in biological tissue transmission has been studied in this work, and the effects of different beam parameters (wavelength, number of dislocations, and spatial self-correlation length) on the changes in polarization state for different field points have been analyzed and compared in detail. We hope that the obtained results in this work will provide theoretical and experimental guidance for the selection of laser parameters in different applications and enhance the development of tissue imaging technology.MethodsBy introducing the Schell term, the cross spectral density matrix of partially coherent circular edge dislocation beams is obtained by the field distribution of the circular edge dislocation beams at the source. Based on the generalized Huygens-Fresnel principle, the analytical expression of the cross spectral density matrix element of partially coherent circular edge dislocation beams propagating biological tissue is derived with the help of the properties of the Hermite function and the complex integration. By means of the unified theory of coherence and polarization, the change in the degree of polarization, orientation angle, and ellipticity of partially coherent circular edge dislocation beams in biological tissue transmission can be investigated by numerical simulation, respectively. Meanwhile, the effects of different beam parameters (beam wavelength, number of dislocations, and spatial self-correlation length) can be analyzed during the transmission process.Results and DiscussionsNumerical calculations show that the magnitude of wavelength and dislocations number of partially coherent circular edge dislocation beams do not affect the initial value of the beam polarization state (Figs. 1-6), while the initial polarization state of beams with different spatial self-correlation length is different (Figs. 7-9). With the increment of propagation distance, the value of the polarization state of the same field point will eventually tend to be consistent with the initial one after experiencing obvious fluctuations, and those between two different field points will eventually move to a fixed one that is different from the initial value (Figs. 1-9), respectively, which may due to the impact of biological tissue turbulence on polarization behaviors. By comparing the changes in polarization between two situations, both the initial and final values show that the difference between two different field points is greater than that of the same field point (Figs. 1, 4, and 7). Far infrared light is prone to resonance in biological tissue transmission, and the polarization state remains almost constant over a certain transmission distance. Ultraviolet light is strongly absorbed by the tissue, and the polarization state of the beam is relatively small. The polarization changes of visible light and near-infrared light are moderate and can be used as probe beams for biomedical disease diagnosis and treatment (Figs. 1-3). A larger dislocation number indicates a greater distance between the extreme values of each polarization characteristic parameter (Figs. 4-6). The relative size of spatial self-correlation length will play a big role in the size and change trend of the polarization state (Figs. 7-9). It can be seen that beams with different beam parameters will have different turbulence resistance abilities, and different beams should be applied in different fields.ConclusionsIn the present study, based on the generalized Huygens-Fresnel principle and the unified theory of coherence and polarization, the influence of different beam parameters on the change in polarization state between two kinds of field points is numerically simulated. The obtained results indicate that compared with far-infrared and ultraviolet light, both visible light and near-infrared light are more suitable as probe beams for biomedical disease diagnosis and treatment. Affected by the turbulence of biological tissue, the polarization state of the beam undergoes evident fluctuations. The beams with different beam parameters have different turbulence resistance abilities, so beams with different parameters will be selected for different applications. The research results obtained in this work will provide a theoretical and experimental guide for the selection of laser parameters and are of great significance for the development of tissue imaging technology. ObjectiveDue to the rapid development of laser optics, the application of optical methods in photoacoustics, photoacoustic imaging, biomedicine photonics, and other fields has received widespread attention presently. As is known, it is significant to study the propagation behaviors of lasers in biological tissue to understand the interaction mechanism between the laser and biological tissue. Up to now, a large number of researchers have studied the polarization behavior of laser beams propagating through different media, such as ocean turbulence, atmospheric turbulence, and free space. In addition, the circular edge dislocation beam belongs to a typical singular beam with a circular notch in the transverse plane along the transmission direction, which undergoes a π mutation in the phase across the notch (dislocation line), and the basic research about the polarization state of circular edge dislocation beams in biological tissue transmission has not been reported yet. In order to promote the application of singularity optics in biomedical disease diagnosis and treatment and the development of tissue imaging technology, the basic research on the polarization behavior of circular edge dislocation beams in biological tissue transmission has been studied in this work, and the effects of different beam parameters (wavelength, number of dislocations, and spatial self-correlation length) on the changes in polarization state for different field points have been analyzed and compared in detail. We hope that the obtained results in this work will provide theoretical and experimental guidance for the selection of laser parameters in different applications and enhance the development of tissue imaging technology.MethodsBy introducing the Schell term, the cross spectral density matrix of partially coherent circular edge dislocation beams is obtained by the field distribution of the circular edge dislocation beams at the source. Based on the generalized Huygens-Fresnel principle, the analytical expression of the cross spectral density matrix element of partially coherent circular edge dislocation beams propagating biological tissue is derived with the help of the properties of the Hermite function and the complex integration. By means of the unified theory of coherence and polarization, the change in the degree of polarization, orientation angle, and ellipticity of partially coherent circular edge dislocation beams in biological tissue transmission can be investigated by numerical simulation, respectively. Meanwhile, the effects of different beam parameters (beam wavelength, number of dislocations, and spatial self-correlation length) can be analyzed during the transmission process.Results and DiscussionsNumerical calculations show that the magnitude of wavelength and dislocations number of partially coherent circular edge dislocation beams do not affect the initial value of the beam polarization state (Figs. 1-6), while the initial polarization state of beams with different spatial self-correlation length is different (Figs. 7-9). With the increment of propagation distance, the value of the polarization state of the same field point will eventually tend to be consistent with the initial one after experiencing obvious fluctuations, and those between two different field points will eventually move to a fixed one that is different from the initial value (Figs. 1-9), respectively, which may due to the impact of biological tissue turbulence on polarization behaviors. By comparing the changes in polarization between two situations, both the initial and final values show that the difference between two different field points is greater than that of the same field point (Figs. 1, 4, and 7). Far infrared light is prone to resonance in biological tissue transmission, and the polarization state remains almost constant over a certain transmission distance. Ultraviolet light is strongly absorbed by the tissue, and the polarization state of the beam is relatively small. The polarization changes of visible light and near-infrared light are moderate and can be used as probe beams for biomedical disease diagnosis and treatment (Figs. 1-3). A larger dislocation number indicates a greater distance between the extreme values of each polarization characteristic parameter (Figs. 4-6). The relative size of spatial self-correlation length will play a big role in the size and change trend of the polarization state (Figs. 7-9). It can be seen that beams with different beam parameters will have different turbulence resistance abilities, and different beams should be applied in different fields.ConclusionsIn the present study, based on the generalized Huygens-Fresnel principle and the unified theory of coherence and polarization, the influence of different beam parameters on the change in polarization state between two kinds of field points is numerically simulated. The obtained results indicate that compared with far-infrared and ultraviolet light, both visible light and near-infrared light are more suitable as probe beams for biomedical disease diagnosis and treatment. Affected by the turbulence of biological tissue, the polarization state of the beam undergoes evident fluctuations. The beams with different beam parameters have different turbulence resistance abilities, so beams with different parameters will be selected for different applications. The research results obtained in this work will provide a theoretical and experimental guide for the selection of laser parameters and are of great significance for the development of tissue imaging technology.
Acta Optica Sinica
- Publication Date: Jan. 25, 2024
- Vol. 44, Issue 2, 0217002 (2024)

Multi-Spectral Blood Oxygen Saturation Detection in Endoscopic Environment
Changwei Zhang, Hongbo Zou, Weiming Qi, Wenwu Zhu, Liqiang Wang, and Bo Yuan
ObjectiveHypoxemia is a common clinical phenomenon that is closely associated with various pathological changes caused by a decrease in oxygen saturation to different degrees. We aim to develop a low-cost blood oxygen saturation detection technology that can be adapted to a wider range of endoscopes for clinical practice and patient diagnosis and treatment. By expanding the application scenarios of endoscopic blood oxygen detection and enriching its practical application value, we hope to help popularize the application of endoscopic technology in remote and resource-scarce areas and improve the coverage and quality of medical services.MethodsWe initially employ the Monte Carlo simulation technique to model and simulate multi-spectral imaging of blood vessel tissue in the visible light range. The absolute value, relative value, absolute difference, and contrast of the backscattering power of blood at different levels of oxygen saturation are analyzed. In response to the complexity of multi-spectral blood oxygen saturation detection in an endoscopic environment, the analytic hierarchy process (AHP) is used to comprehensively analyze various factors that could potentially interfere with the results. By adopting a hierarchical analysis approach, the factors that could potentially interfere with blood oxygen detection are categorized into four major groups: controllable conditions before the experiment, controllable conditions during the experiment, errors before the experiment, and errors during the experiment. After assigning importance ratings to these factors, questionnaires are distributed to laboratory researchers, physicians, and other professionals, so as to gather their opinions on the various sub-categories within each major group. By combining the opinions obtained through the questionnaire with AHP, we derive the importance weightings of the top 16 factors that could potentially interfere with the experimental results, and all weightings are below 0.06. Based on this analysis, four imaging bands suitable for endoscopic environments are selected: absolute difference, relative value, absolute value, contrast, and disturbance resistance. With the blue and green light bands primarily used to measure changes in light source power and consider imaging contrast and the red light band primarily used to measure changes in blood oxygen saturation and highly influenced by interfering factors, these four optimal imaging bands are utilized for experimental verification of blood oxygen saturation detection.Results and DiscussionsWhen the optimal bands were selected, in response to the complexity of multi-spectral blood oxygen saturation detection in an endoscopic environment, AHP is employed to comprehensively analyze various factors that could potentially interfere with the results. The weights of indicators representing the level of resistance to external interference in an endoscopic environment are obtained through this analysis (Fig. 3). Considering the impact of each influencing factor, we conduct an optimal analysis of the blood oxygen saturation detection bands by combining the characteristics of contrast and backscattering power. The potential effects of various influencing factors on endoscopic blood oxygen detection results are determined (Fig. 4). Based on this analysis, four imaging bands suitable for endoscopic environments are selected, namely, 450 nm, 525 nm, 630 nm, and 660 nm (Fig. 5). Built upon these selected wavelengths, a blood oxygen saturation prediction model is established by defining an intermediate variable based on the difference ratio of two backscattering powers. The model considers both fixed endoscopic detection distances and arbitrary intervals. The accuracy and effectiveness of the model are validated through experiments. The results indicate that under equidistant conditions, the deviation of blood oxygen saturation is 0.77% at a confidence level of 95% and 1.01% at a confidence level of 99%. Under non-equidistant conditions, the deviation of blood oxygen saturation is 0.94% at a confidence level of 95% and 1.24% at a confidence level of 99% (Fig. 9).ConclusionsWe investigate the diffuse reflectance power and contrast of different bands of visible light under different blood oxygen saturation conditions in an endoscopic environment using the Monte Carlo simulation algorithm. Additionally, we examine 16 influencing factors that may affect blood oxygen saturation detection in an endoscopic environment and combine AHP to determine the resistance to interference of various bands under red light. Based on the characteristics of the red, green, and blue bands, a comprehensive analysis combining contrast, resistance to interference, absolute value of power detection, absolute difference, and relative value is conducted to select the optimal bands, namely 450 nm, 525 nm, 630 nm, and 660 nm. Moreover, based on these selected bands, blood oxygen saturation analysis formulas are proposed for both equidistant and non-equidistant states, utilizing a quadratic cubic expression. These formulas have the advantages of simplicity in structure and quick calculation. Furthermore, laboratory experiments are conducted on vascular phantoms using an endoscope to verify the feasibility and scientific validity of the simulation experiments and the selected band method. Finally, we compare the four-band selection method with the three-band selection method, the non-equidistant band method, and the blood oxygen reverse construction method, demonstrating the advantages of the four-band selection method in terms of the accuracy and cost of blood oxygen saturation detection. ObjectiveHypoxemia is a common clinical phenomenon that is closely associated with various pathological changes caused by a decrease in oxygen saturation to different degrees. We aim to develop a low-cost blood oxygen saturation detection technology that can be adapted to a wider range of endoscopes for clinical practice and patient diagnosis and treatment. By expanding the application scenarios of endoscopic blood oxygen detection and enriching its practical application value, we hope to help popularize the application of endoscopic technology in remote and resource-scarce areas and improve the coverage and quality of medical services.MethodsWe initially employ the Monte Carlo simulation technique to model and simulate multi-spectral imaging of blood vessel tissue in the visible light range. The absolute value, relative value, absolute difference, and contrast of the backscattering power of blood at different levels of oxygen saturation are analyzed. In response to the complexity of multi-spectral blood oxygen saturation detection in an endoscopic environment, the analytic hierarchy process (AHP) is used to comprehensively analyze various factors that could potentially interfere with the results. By adopting a hierarchical analysis approach, the factors that could potentially interfere with blood oxygen detection are categorized into four major groups: controllable conditions before the experiment, controllable conditions during the experiment, errors before the experiment, and errors during the experiment. After assigning importance ratings to these factors, questionnaires are distributed to laboratory researchers, physicians, and other professionals, so as to gather their opinions on the various sub-categories within each major group. By combining the opinions obtained through the questionnaire with AHP, we derive the importance weightings of the top 16 factors that could potentially interfere with the experimental results, and all weightings are below 0.06. Based on this analysis, four imaging bands suitable for endoscopic environments are selected: absolute difference, relative value, absolute value, contrast, and disturbance resistance. With the blue and green light bands primarily used to measure changes in light source power and consider imaging contrast and the red light band primarily used to measure changes in blood oxygen saturation and highly influenced by interfering factors, these four optimal imaging bands are utilized for experimental verification of blood oxygen saturation detection.Results and DiscussionsWhen the optimal bands were selected, in response to the complexity of multi-spectral blood oxygen saturation detection in an endoscopic environment, AHP is employed to comprehensively analyze various factors that could potentially interfere with the results. The weights of indicators representing the level of resistance to external interference in an endoscopic environment are obtained through this analysis (Fig. 3). Considering the impact of each influencing factor, we conduct an optimal analysis of the blood oxygen saturation detection bands by combining the characteristics of contrast and backscattering power. The potential effects of various influencing factors on endoscopic blood oxygen detection results are determined (Fig. 4). Based on this analysis, four imaging bands suitable for endoscopic environments are selected, namely, 450 nm, 525 nm, 630 nm, and 660 nm (Fig. 5). Built upon these selected wavelengths, a blood oxygen saturation prediction model is established by defining an intermediate variable based on the difference ratio of two backscattering powers. The model considers both fixed endoscopic detection distances and arbitrary intervals. The accuracy and effectiveness of the model are validated through experiments. The results indicate that under equidistant conditions, the deviation of blood oxygen saturation is 0.77% at a confidence level of 95% and 1.01% at a confidence level of 99%. Under non-equidistant conditions, the deviation of blood oxygen saturation is 0.94% at a confidence level of 95% and 1.24% at a confidence level of 99% (Fig. 9).ConclusionsWe investigate the diffuse reflectance power and contrast of different bands of visible light under different blood oxygen saturation conditions in an endoscopic environment using the Monte Carlo simulation algorithm. Additionally, we examine 16 influencing factors that may affect blood oxygen saturation detection in an endoscopic environment and combine AHP to determine the resistance to interference of various bands under red light. Based on the characteristics of the red, green, and blue bands, a comprehensive analysis combining contrast, resistance to interference, absolute value of power detection, absolute difference, and relative value is conducted to select the optimal bands, namely 450 nm, 525 nm, 630 nm, and 660 nm. Moreover, based on these selected bands, blood oxygen saturation analysis formulas are proposed for both equidistant and non-equidistant states, utilizing a quadratic cubic expression. These formulas have the advantages of simplicity in structure and quick calculation. Furthermore, laboratory experiments are conducted on vascular phantoms using an endoscope to verify the feasibility and scientific validity of the simulation experiments and the selected band method. Finally, we compare the four-band selection method with the three-band selection method, the non-equidistant band method, and the blood oxygen reverse construction method, demonstrating the advantages of the four-band selection method in terms of the accuracy and cost of blood oxygen saturation detection.
Acta Optica Sinica
- Publication Date: Jan. 25, 2024
- Vol. 44, Issue 2, 0217001 (2024)
Near-Infrared Three-Dimensional Imaging System and Recognition Algorithm for Subcutaneous Blood Vessels
Jialing Qiu, Zhuang Fu, Huiliang Jin, Jian Fei, and Rongli Xie
ObjectiveAn imaging system and processing algorithm for the extraction and three-dimensional imaging of subcutaneous blood vessels is proposed to overcome the difficulty of vascular recognition in thick parts of surface tissue. Vascular visualization technology is used in the medical field to treat scenarios such as venipuncture and interventional therapy to reduce the additional trauma to the patient. Since hemoglobin in the blood has a higher absorption rate of light in the near-infrared (NIR) band (700-1000 nm) than lipids, proteins, and water, vascular tissue appears as a dark shadow area projected on the surface of the skin in images taken in the NIR band, and the position of the shadow area changes with the viewing perspective. According to the above principles, some researchers use multi-view imaging technology to perform three-dimensional reconstruction of subcutaneous blood vessels. This technique consists of two main steps: the first one is the vascular segmentation on the grayscale image, and the second one is the stereo matching on multi-view images to reconstruct the three-dimensional information of blood vessels. However, in the available literature, the applicable body parts of the equipment are limited due to the light source and camera arrangement. Other drawbacks include the noise line segment in the extraction result and the lack of algorithm efficiency optimization. Therefore, we hope to design a vascular recognition module for the automatic puncture robot from the aspects of the light source and camera arrangement design and the improvement in the vascular skeleton extraction algorithm.MethodsThe optimization of the vascular segmentation effect includes the optimization of the original image quality and that of the image processing algorithm. Some studies have shown that improving the irradiance uniformity of the light source on the body surface can make the vascular region more distinctive in the grayscale image. Given such knowledge, our imaging system design uses a convergent binocular NIR-enhanced camera kit and a NIR LED array. We calculate the radiation of the LED bead according to the irradiance distribution formula of the approximate Lambertian source and use MATLAB software to simulate the total irradiance distribution of the LED array on a cylindrical surface (Fig. 2) and make a symmetrical two-board LED array light source according to the optimal design parameters (Fig. 3). The subsequent research on vascular skeleton extraction is carried out on the images taken with the designed imaging system. It includes seven steps: 1) selecting the region of interest (ROI); 2) weakening the image background; 3) performing contrast-limited adaptive histogram equalization (CLAHE); 4) performing two-dimensional Frangi filtering of multi-scale images; 5) performing Otsu's adaptive-threshold image binarization; 6) extracting the vascular skeleton by Zhang's thinning method; 7) performing skeleton branch pruning to remove noise line segments. The vascular skeleton in the left image is extracted by the above algorithm, and then the depth of the vascular skeleton is calculated by an improved sliding window algorithm with the information on the corresponding right image.Results and DiscussionsFirst, the designed imaging system is used to take NIR images of different parts of the body surface, including the back of the hands, forearms, and neck. The intermediate results of the vascular skeleton extraction algorithm (Fig. 5) and the three-dimensional reconstruction results of those body parts (Fig. 12) are analyzed. In addition, a bionic model is built with defibrinated sheep blood, beef slices, and pig skin (Fig. 8) to evaluate the consistency between real blood vessels and the vascular skeleton obtained by this system. The image processing results verify that the central line of the vascular skeleton extracted by this system can be consistent with the real blood vessel (Fig. 10), and the three-dimensional information on the obtained blood vessel is accurate (Fig. 11). For a higher processing speed of the vascular skeleton extraction algorithm, we rewrite the aforementioned algorithm to a parallel mode for GPU acceleration, then shoot 45 sets of left and right image pairs of different body parts, and record the processing speed of the original CPU algorithm and the GPU algorithm for a single image frame. The statistical results show that the GPU algorithm after acceleration takes an average of 64.40 ms per frame, which is 64% less than the original CPU algorithm. The improved sliding window matching algorithm takes an average of 105.32 ms per frame, and hence, the whole three-dimensional reconstruction process with GPU acceleration takes about 170 ms per frame.ConclusionsThe proposed three-dimensional imaging system for NIR subcutaneous blood vessels can effectively generate accurate three-dimensional images of subcutaneous blood vessels, which is suitable for various body parts such as the neck, forearm, and back of the hands and can also achieve good performance in thicker parts of surface tissue. The experimental results show that the extracted blood vessels are consistent with the real blood vessels, and the designed image processing algorithm takes an average total processing time of about 170 ms per frame. Hence, the expected reconstruction frame rate can reach 5 frame/s, which meets the requirements of intraoperative real-time modeling. To make this imaging system a module of the automatic puncture robot in the future, follow-up studies should include two aspects. The first one is to collect subcutaneous vascular patterns of people with different skin colors and different body fat content for the research on the adaptive adjustment method of skeleton extraction algorithm parameters. The second one is to build a theoretical model of light propagation in superficial biological tissues to correct the error of vascular depth estimation caused by light scattering. ObjectiveAn imaging system and processing algorithm for the extraction and three-dimensional imaging of subcutaneous blood vessels is proposed to overcome the difficulty of vascular recognition in thick parts of surface tissue. Vascular visualization technology is used in the medical field to treat scenarios such as venipuncture and interventional therapy to reduce the additional trauma to the patient. Since hemoglobin in the blood has a higher absorption rate of light in the near-infrared (NIR) band (700-1000 nm) than lipids, proteins, and water, vascular tissue appears as a dark shadow area projected on the surface of the skin in images taken in the NIR band, and the position of the shadow area changes with the viewing perspective. According to the above principles, some researchers use multi-view imaging technology to perform three-dimensional reconstruction of subcutaneous blood vessels. This technique consists of two main steps: the first one is the vascular segmentation on the grayscale image, and the second one is the stereo matching on multi-view images to reconstruct the three-dimensional information of blood vessels. However, in the available literature, the applicable body parts of the equipment are limited due to the light source and camera arrangement. Other drawbacks include the noise line segment in the extraction result and the lack of algorithm efficiency optimization. Therefore, we hope to design a vascular recognition module for the automatic puncture robot from the aspects of the light source and camera arrangement design and the improvement in the vascular skeleton extraction algorithm.MethodsThe optimization of the vascular segmentation effect includes the optimization of the original image quality and that of the image processing algorithm. Some studies have shown that improving the irradiance uniformity of the light source on the body surface can make the vascular region more distinctive in the grayscale image. Given such knowledge, our imaging system design uses a convergent binocular NIR-enhanced camera kit and a NIR LED array. We calculate the radiation of the LED bead according to the irradiance distribution formula of the approximate Lambertian source and use MATLAB software to simulate the total irradiance distribution of the LED array on a cylindrical surface (Fig. 2) and make a symmetrical two-board LED array light source according to the optimal design parameters (Fig. 3). The subsequent research on vascular skeleton extraction is carried out on the images taken with the designed imaging system. It includes seven steps: 1) selecting the region of interest (ROI); 2) weakening the image background; 3) performing contrast-limited adaptive histogram equalization (CLAHE); 4) performing two-dimensional Frangi filtering of multi-scale images; 5) performing Otsu's adaptive-threshold image binarization; 6) extracting the vascular skeleton by Zhang's thinning method; 7) performing skeleton branch pruning to remove noise line segments. The vascular skeleton in the left image is extracted by the above algorithm, and then the depth of the vascular skeleton is calculated by an improved sliding window algorithm with the information on the corresponding right image.Results and DiscussionsFirst, the designed imaging system is used to take NIR images of different parts of the body surface, including the back of the hands, forearms, and neck. The intermediate results of the vascular skeleton extraction algorithm (Fig. 5) and the three-dimensional reconstruction results of those body parts (Fig. 12) are analyzed. In addition, a bionic model is built with defibrinated sheep blood, beef slices, and pig skin (Fig. 8) to evaluate the consistency between real blood vessels and the vascular skeleton obtained by this system. The image processing results verify that the central line of the vascular skeleton extracted by this system can be consistent with the real blood vessel (Fig. 10), and the three-dimensional information on the obtained blood vessel is accurate (Fig. 11). For a higher processing speed of the vascular skeleton extraction algorithm, we rewrite the aforementioned algorithm to a parallel mode for GPU acceleration, then shoot 45 sets of left and right image pairs of different body parts, and record the processing speed of the original CPU algorithm and the GPU algorithm for a single image frame. The statistical results show that the GPU algorithm after acceleration takes an average of 64.40 ms per frame, which is 64% less than the original CPU algorithm. The improved sliding window matching algorithm takes an average of 105.32 ms per frame, and hence, the whole three-dimensional reconstruction process with GPU acceleration takes about 170 ms per frame.ConclusionsThe proposed three-dimensional imaging system for NIR subcutaneous blood vessels can effectively generate accurate three-dimensional images of subcutaneous blood vessels, which is suitable for various body parts such as the neck, forearm, and back of the hands and can also achieve good performance in thicker parts of surface tissue. The experimental results show that the extracted blood vessels are consistent with the real blood vessels, and the designed image processing algorithm takes an average total processing time of about 170 ms per frame. Hence, the expected reconstruction frame rate can reach 5 frame/s, which meets the requirements of intraoperative real-time modeling. To make this imaging system a module of the automatic puncture robot in the future, follow-up studies should include two aspects. The first one is to collect subcutaneous vascular patterns of people with different skin colors and different body fat content for the research on the adaptive adjustment method of skeleton extraction algorithm parameters. The second one is to build a theoretical model of light propagation in superficial biological tissues to correct the error of vascular depth estimation caused by light scattering.
Acta Optica Sinica
- Publication Date: May. 10, 2023
- Vol. 43, Issue 9, 0917001 (2023)
Detection Method of Regional Cerebral Blood Flow Based on Interferometric Diffusing Speckle Contrast Imaging Technology
Guang Han, Hao Feng, Siqi Chen, Zhe Zhao, Jinhai Wang, and Huiquan Wang
ObjectiveCerebral blood flow (CBF) is the main objective index for clinical diagnosis of cerebrovascular diseases such as cerebral infarction and cerebral hemorrhage. Among them, the measurement of regional cerebral blood flow (rCBF) is of great significance for targeted long-term and real-time detection of target areas of specific diseases such as epilepsy and Alzheimer's disease. In recent years, non-invasive spectral methods for CBF detection have developed rapidly. The more widely employed blood flow monitoring methods are laser speckle contrast imaging (LSCI), diffuse correlation spectroscopy (DCS), interferometric diffusing wave spectroscopy (iDWS), and diffusing speckle contrast analysis (DSCA), which all share the advantage of non-invasive measurement of blood flow adopting non-ionizing radiation. In addition to building an analytical model for detecting rCBF, this paper proposes an interferometric diffusing speckle contrast analysis (iDSCA) method and further constructs an experimental system. The system consists of three modules of laser source module, optical heterodyne module, and imaging acquisition module.MethodsThe iDSCA method combines the advantages of iDWS and DSCA, which can achieve high sensitivity and high-resolution two-dimensional velocity imaging, and is of research significance for the long-term detection of rCBF. The electric field intensity of scattered light carries the motion information of scattered particles. In the DSCA principle, the speckle contrast K of diffusing speckle is the integral function of the electric field time autocorrelation function within the exposure time, and it is also the blurring degree of the dynamic speckle image. The reciprocal of its square is employed as the relative blood flow index (BFI) of scattered particles to evaluate the actual blood flow state. Aiming at the measurement error caused by various noise interference in the iDSCA model to calculate the speckle contrast K, the real speckle contrast K obtained by pre-evaluating and correcting the system noise can avoid interference such as laser source noise and camera noise. In this study, the feasibility of this method to detect the linearity of rCBF flow velocity, and the discrimination ability and quantitative analysis ability of this system for different target regions of blood vessels to be measured are verified by analyzing the parameters of multiple diameters and multiple distances through the local phantom flow velocity experiment of the brain. In addition, in vivo experiments and cuff-induced occlusion protocol experiments are carried out at different parts, and blood pressure is measured simultaneously.Results and DiscussionsThe system can effectively improve the signal-to-noise ratio and detection accuracy of non-invasive rCBF detection. The results of phantom flow velocity experiments show that the relative BFI has good linearity with the actual flow velocity, and the average linear correlation coefficient within the source-detector distance (SD) of 6–12 mm is 0.9881 ± 0.0005 (Fig. 6). This detection method can distinguish the flow velocity changes in different target areas, and the relative error of 4.8 mm tube diameter is 2.04% (Table 1). Combined with the vascular diameter measurement method, the flow velocity and flow can be effectively monitored. The increasing trend of BFI measured at SD of 6-12 mm is consistent with the change of flow. The results show that the system can better detect the target area to be measured with a large cross-sectional area within the effective range (Fig. 7). Through in vivo experiments and cuff-induced occlusion protocol experiments (Fig. 8 and Fig. 9), it is proven that the system can detect the flow velocity information of rCBF in vivo and has good detection accuracy within the range of effective measurement flow velocity.ConclusionsAs the optical method for monitoring rCBF is difficult to achieve two-dimensional blood flow imaging, this paper builds a diffusion speckle imaging system with optical heterodyne structure based on the diffusing interference spectrum technology. The improved diffusing speckle contrast analysis method is combined to detect rCBF in real time. Firstly, the feasibility of the system to detect the flow velocity linearity, the discrimination ability, and the quantitative analysis ability of different target areas to be measured are verified through the experimental design of the phantom flow velocity of the brain from analyzing multi-diameter and multi-distance parameters. Secondly, the in vivo experiments of different parts are further designed to verify the measured BFI signals by combining signals of blood pressure. Additionally, the cuff-induced occlusion protocol is conducted to compare the BFI waveforms in three states to verify the reliability of the system detecting and distinguishing rCBF in different regions. This study is expected to achieve non-invasive and long-term monitoring of rCBF and provide a theoretical basis for early diagnosis and treatment of cerebrovascular diseases. In the future, studies will be further conducted on the qualitative and quantitative analysis ability of the system combined with the iDSCA method to detect rCBF, and the clinical application value of rCBF two-dimensional blood flow imaging. ObjectiveCerebral blood flow (CBF) is the main objective index for clinical diagnosis of cerebrovascular diseases such as cerebral infarction and cerebral hemorrhage. Among them, the measurement of regional cerebral blood flow (rCBF) is of great significance for targeted long-term and real-time detection of target areas of specific diseases such as epilepsy and Alzheimer's disease. In recent years, non-invasive spectral methods for CBF detection have developed rapidly. The more widely employed blood flow monitoring methods are laser speckle contrast imaging (LSCI), diffuse correlation spectroscopy (DCS), interferometric diffusing wave spectroscopy (iDWS), and diffusing speckle contrast analysis (DSCA), which all share the advantage of non-invasive measurement of blood flow adopting non-ionizing radiation. In addition to building an analytical model for detecting rCBF, this paper proposes an interferometric diffusing speckle contrast analysis (iDSCA) method and further constructs an experimental system. The system consists of three modules of laser source module, optical heterodyne module, and imaging acquisition module.MethodsThe iDSCA method combines the advantages of iDWS and DSCA, which can achieve high sensitivity and high-resolution two-dimensional velocity imaging, and is of research significance for the long-term detection of rCBF. The electric field intensity of scattered light carries the motion information of scattered particles. In the DSCA principle, the speckle contrast K of diffusing speckle is the integral function of the electric field time autocorrelation function within the exposure time, and it is also the blurring degree of the dynamic speckle image. The reciprocal of its square is employed as the relative blood flow index (BFI) of scattered particles to evaluate the actual blood flow state. Aiming at the measurement error caused by various noise interference in the iDSCA model to calculate the speckle contrast K, the real speckle contrast K obtained by pre-evaluating and correcting the system noise can avoid interference such as laser source noise and camera noise. In this study, the feasibility of this method to detect the linearity of rCBF flow velocity, and the discrimination ability and quantitative analysis ability of this system for different target regions of blood vessels to be measured are verified by analyzing the parameters of multiple diameters and multiple distances through the local phantom flow velocity experiment of the brain. In addition, in vivo experiments and cuff-induced occlusion protocol experiments are carried out at different parts, and blood pressure is measured simultaneously.Results and DiscussionsThe system can effectively improve the signal-to-noise ratio and detection accuracy of non-invasive rCBF detection. The results of phantom flow velocity experiments show that the relative BFI has good linearity with the actual flow velocity, and the average linear correlation coefficient within the source-detector distance (SD) of 6–12 mm is 0.9881 ± 0.0005 (Fig. 6). This detection method can distinguish the flow velocity changes in different target areas, and the relative error of 4.8 mm tube diameter is 2.04% (Table 1). Combined with the vascular diameter measurement method, the flow velocity and flow can be effectively monitored. The increasing trend of BFI measured at SD of 6-12 mm is consistent with the change of flow. The results show that the system can better detect the target area to be measured with a large cross-sectional area within the effective range (Fig. 7). Through in vivo experiments and cuff-induced occlusion protocol experiments (Fig. 8 and Fig. 9), it is proven that the system can detect the flow velocity information of rCBF in vivo and has good detection accuracy within the range of effective measurement flow velocity.ConclusionsAs the optical method for monitoring rCBF is difficult to achieve two-dimensional blood flow imaging, this paper builds a diffusion speckle imaging system with optical heterodyne structure based on the diffusing interference spectrum technology. The improved diffusing speckle contrast analysis method is combined to detect rCBF in real time. Firstly, the feasibility of the system to detect the flow velocity linearity, the discrimination ability, and the quantitative analysis ability of different target areas to be measured are verified through the experimental design of the phantom flow velocity of the brain from analyzing multi-diameter and multi-distance parameters. Secondly, the in vivo experiments of different parts are further designed to verify the measured BFI signals by combining signals of blood pressure. Additionally, the cuff-induced occlusion protocol is conducted to compare the BFI waveforms in three states to verify the reliability of the system detecting and distinguishing rCBF in different regions. This study is expected to achieve non-invasive and long-term monitoring of rCBF and provide a theoretical basis for early diagnosis and treatment of cerebrovascular diseases. In the future, studies will be further conducted on the qualitative and quantitative analysis ability of the system combined with the iDSCA method to detect rCBF, and the clinical application value of rCBF two-dimensional blood flow imaging.
Acta Optica Sinica
- Publication Date: Apr. 10, 2023
- Vol. 43, Issue 7, 0717002 (2023)
Trace Detection of Nitrofuran Drugs Based on Terahertz Meta-Surface Sensor
Tingting Yuan, Jingwen Wu, Yanhua Bo, Jianjun Liu, Zhi Hong, and Yong Du
ObjectiveNitrofuran is a typical broad-spectrum antibiotic. Its derivatives and nitrofuran compounds are widely used in clinical practice and veterinary medicine and can be employed to preserve animal feed, prevent and treat gastrointestinal infections caused by bacteria, and accelerate animal growth. However, studies have proven that nitrofuran and its metabolites have carcinogenic and teratogenic side effects on humans and that diseases such as hemolytic anemia and acute liver necrosis can also occur if excess nitrofuran antibiotics are consumed. This has gradually caused concern. Therefore, high-sensitivity monitoring of nitrofuran is important for safeguarding human health and life safety. Traditional methods such as chromatography, enzyme-linked immunosorbent assay (ELISA), and liquid chromatography-mass spectrometry (LC-MS) have the disadvantages of a long pre-treatment and analysis period, cumbersome processing, massive sample usage, and a high false-positive rate of test results. Therefore, it is necessary to find a rapid, accurate, and stable assay for monitoring the use of nitrofuran drugs. As biological samples are often present in a diluted state, sensitive detection of biomolecules without any binding site markers or aids remains challenging. Metamaterials have unique optical properties and exhibit unique characteristics, such as local electric field enhancement, which can be tuned by the geometric design of metamaterials. The electric field enhancement in metamaterials can improve the interaction between the sample and terahertz (THz) waves. Thus, the use of THz metamaterials as a sensing platform can overcome the low sensitivity of biological samples in the THz range and enable biomolecular detection in a label-free manner. We hope that the use of metamaterials will enable the non-destructive and rapid detection of nitrofuran drugs.MethodsTHz waves are parts of electromagnetic waves between far infrared and microwave, which have good safety and fingerprinting properties for substance identification without damaging effects on substances. The basic principle of THz time-domain spectroscopy is to use femtosecond pulses to generate and detect time-resolved THz electric fields and to obtain spectral information of the measured item through the Fourier transform. Since the vibration and rotation energy levels of macromolecules are mostly in the THz region, and macromolecules, especially biological and chemical macromolecules, are groups of substances with physical properties, the structure and physical properties of substances can thus be analyzed and identified through characteristic THz frequencies. Meta-surfaces are two-dimensional artificial sub-wavelength periodic structures that can better respond to electromagnetic waves compared to natural materials. The electromagnetic waves are modulated by the change in the shape and size of the structure. A change in the refractive index of a sample attached to the surface of a meta-surface sensor can alter the local field of the meta-surface, which is reflected by the change in the resonance peak of the spectrum. In this paper, a symmetrical open-ring meta-surface structure is designed, which has two layers. The open-ring surface structure is constructed from metallic aluminum (Al), and the substrate structure is constructed from polyimide (PI). PI is a flexible material that has the advantages of a small dielectric constant and stable properties and is non-damaging to biological materials. Simulations of the meta-surface are based on the simulation software CST Studio Suite with a full-vector finite element method (FEM). The structure has a refractive index sensitivity of 196 GHz/RIU and can be applied for high-sensitivity sensing detection. Experiments are performed with different mass concentration gradients of furazolidone and furantoin solutions. 60 μL of different mass concentrations of analytes are added dropwise to the meta-surface structure by a pipette, and then it is heated to 50 ℃ and left to dry. THz pulses are incident vertically on the furan-covered meta-surface for spectral acquisition.Results and DiscussionsThe meta-surface structure designed in this paper is simple and has a low processing cost, and its detection is more intuitive and faster and requires fewer samples than conventional methods. The refractive index sensitivity of 196 GHz/RIU is achieved when the refractive index n varies from 1.0 to 1.8, which allows the structure to be used as a high-sensitivity refractive index sensor (Fig. 7). To demonstrate the enhanced detection capability of the meta-surface structure for nitrofuran drugs, we measure THz spectra before and after the dropwise addition of the furazolidone solution to the polyimide substrate. No significant change in the transmission spectrum is observed. In contrast, the meta-surface structure shows a significant red shift in the position of the transmission peak after the dropwise addition of the furazolidone solution (Fig. 8). In the measurement of the THz transmission spectra of furazolidone and furantoin in the mass concentration range of 10-1000 mg/dL, there is a regular red shift at the resonant frequency of the sensor with the increasing concentration and a significant frequency shift. The experimental results indicate that the meta-surface structure can effectively enhance the interaction between furazolidone and THz waves with high sensitivity. The results of several experiments demonstrate that the limited detection mass concentration of 10 mg/dL for both furazolidone and furantoin is achieved (Figs. 10 and 13). This meta-surface is expected to be used for highly sensitive sensing detection.ConclusionsIn this paper, the resonance characteristics and sensing performance of a THz meta-surface sensor based on a symmetrical open ring are investigated. Theoretical simulations show that its refractive index sensitivity reaches 196 GHz/RIU and can be applied to high-sensitivity sensing detection. The results indicate that the sensor can detect two nitrofuran drugs (furazolidone and furantoin) at a minimum mass concentration of 10 mg/dL. This sensing method is mainly based on the difference in dielectric properties of the analytes to be measured, and thus, the meta-surface structure can be applied to the detection of other antibiotics or biochemical samples. This provides a good theoretical and experimental basis for the future development of high-sensitivity sensors. ObjectiveNitrofuran is a typical broad-spectrum antibiotic. Its derivatives and nitrofuran compounds are widely used in clinical practice and veterinary medicine and can be employed to preserve animal feed, prevent and treat gastrointestinal infections caused by bacteria, and accelerate animal growth. However, studies have proven that nitrofuran and its metabolites have carcinogenic and teratogenic side effects on humans and that diseases such as hemolytic anemia and acute liver necrosis can also occur if excess nitrofuran antibiotics are consumed. This has gradually caused concern. Therefore, high-sensitivity monitoring of nitrofuran is important for safeguarding human health and life safety. Traditional methods such as chromatography, enzyme-linked immunosorbent assay (ELISA), and liquid chromatography-mass spectrometry (LC-MS) have the disadvantages of a long pre-treatment and analysis period, cumbersome processing, massive sample usage, and a high false-positive rate of test results. Therefore, it is necessary to find a rapid, accurate, and stable assay for monitoring the use of nitrofuran drugs. As biological samples are often present in a diluted state, sensitive detection of biomolecules without any binding site markers or aids remains challenging. Metamaterials have unique optical properties and exhibit unique characteristics, such as local electric field enhancement, which can be tuned by the geometric design of metamaterials. The electric field enhancement in metamaterials can improve the interaction between the sample and terahertz (THz) waves. Thus, the use of THz metamaterials as a sensing platform can overcome the low sensitivity of biological samples in the THz range and enable biomolecular detection in a label-free manner. We hope that the use of metamaterials will enable the non-destructive and rapid detection of nitrofuran drugs.MethodsTHz waves are parts of electromagnetic waves between far infrared and microwave, which have good safety and fingerprinting properties for substance identification without damaging effects on substances. The basic principle of THz time-domain spectroscopy is to use femtosecond pulses to generate and detect time-resolved THz electric fields and to obtain spectral information of the measured item through the Fourier transform. Since the vibration and rotation energy levels of macromolecules are mostly in the THz region, and macromolecules, especially biological and chemical macromolecules, are groups of substances with physical properties, the structure and physical properties of substances can thus be analyzed and identified through characteristic THz frequencies. Meta-surfaces are two-dimensional artificial sub-wavelength periodic structures that can better respond to electromagnetic waves compared to natural materials. The electromagnetic waves are modulated by the change in the shape and size of the structure. A change in the refractive index of a sample attached to the surface of a meta-surface sensor can alter the local field of the meta-surface, which is reflected by the change in the resonance peak of the spectrum. In this paper, a symmetrical open-ring meta-surface structure is designed, which has two layers. The open-ring surface structure is constructed from metallic aluminum (Al), and the substrate structure is constructed from polyimide (PI). PI is a flexible material that has the advantages of a small dielectric constant and stable properties and is non-damaging to biological materials. Simulations of the meta-surface are based on the simulation software CST Studio Suite with a full-vector finite element method (FEM). The structure has a refractive index sensitivity of 196 GHz/RIU and can be applied for high-sensitivity sensing detection. Experiments are performed with different mass concentration gradients of furazolidone and furantoin solutions. 60 μL of different mass concentrations of analytes are added dropwise to the meta-surface structure by a pipette, and then it is heated to 50 ℃ and left to dry. THz pulses are incident vertically on the furan-covered meta-surface for spectral acquisition.Results and DiscussionsThe meta-surface structure designed in this paper is simple and has a low processing cost, and its detection is more intuitive and faster and requires fewer samples than conventional methods. The refractive index sensitivity of 196 GHz/RIU is achieved when the refractive index n varies from 1.0 to 1.8, which allows the structure to be used as a high-sensitivity refractive index sensor (Fig. 7). To demonstrate the enhanced detection capability of the meta-surface structure for nitrofuran drugs, we measure THz spectra before and after the dropwise addition of the furazolidone solution to the polyimide substrate. No significant change in the transmission spectrum is observed. In contrast, the meta-surface structure shows a significant red shift in the position of the transmission peak after the dropwise addition of the furazolidone solution (Fig. 8). In the measurement of the THz transmission spectra of furazolidone and furantoin in the mass concentration range of 10-1000 mg/dL, there is a regular red shift at the resonant frequency of the sensor with the increasing concentration and a significant frequency shift. The experimental results indicate that the meta-surface structure can effectively enhance the interaction between furazolidone and THz waves with high sensitivity. The results of several experiments demonstrate that the limited detection mass concentration of 10 mg/dL for both furazolidone and furantoin is achieved (Figs. 10 and 13). This meta-surface is expected to be used for highly sensitive sensing detection.ConclusionsIn this paper, the resonance characteristics and sensing performance of a THz meta-surface sensor based on a symmetrical open ring are investigated. Theoretical simulations show that its refractive index sensitivity reaches 196 GHz/RIU and can be applied to high-sensitivity sensing detection. The results indicate that the sensor can detect two nitrofuran drugs (furazolidone and furantoin) at a minimum mass concentration of 10 mg/dL. This sensing method is mainly based on the difference in dielectric properties of the analytes to be measured, and thus, the meta-surface structure can be applied to the detection of other antibiotics or biochemical samples. This provides a good theoretical and experimental basis for the future development of high-sensitivity sensors.
Acta Optica Sinica
- Publication Date: Apr. 10, 2023
- Vol. 43, Issue 7, 0717001 (2023)
Design of Optical System for Nasal Mucociliary Microendoscope
Xin Wang, Yang Xiang, Dawei Feng, Kaiming Yang, Chuan Pang, and Lei Chen
Results and Discussions In this paper, we propose a method for direct observation of nasal mucosa cilia by a rigid microendoscope, which can avoid the damage of cilia functions and the pain of subjects caused by sampling and greatly improve the clinical diagnostic ability of cilia-related diseases. The numerical aperture of the system is 0.15, which greatly improves the resolution ability of the system. The relay system changes the HOPKINS structure to make a negative lens separated into a thick lens to effectively correct the field curvature. The system is designed as a variable-magnification structure, which can magnify objects as required. In this paper, the integrated design of the eyepiece system and the variable-magnification adapter system, as well as that of the whole system are proposed to simplify the structure, correct the aberration to the maximum extent, and achieve the imaging quality to the diffraction limit.ObjectiveMotile cilia of nasal mucosa are widely distributed on the mucosal surface of the human respiratory tract. The defense function of removing mucus and pathogenic particles from the mucosal surface can be realized by swinging regularly in a specific direction. The normal operation of this function is important for maintaining respiratory tract health and human health. The dysfunction of cilia will lead to a series of pathological manifestations, which will seriously affect the health and quality of life of patients. The traditional ciliary motion assessment methods are invasive and cannot reflect the actual motion state of the body. In order to perform direct microscopic imaging of the nasal mucosal surface through the anterior nostril for non-invasive observation and measurement of nasal ciliary movement in vivo, we design a variable-magnification rigid microendoscope with a viewing angle of 30°. The nasal mucosal ciliary microendoscope will avoid the damage to ciliary function and the pain of subjects caused by material extraction, which thus greatly improves the clinical diagnosis ability of cilia-related diseases and becomes an important breakthrough in the scientific research and clinical work in the field of cilia.Methods The design of the optical system of the nasal mucociliary microendoscope is mainly divided into three aspectsoptical system design, image quality analysis, and tolerance analysis. The optical system mainly includes an objective lens system, relay system, eyepiece system, and variational adapter system. Firstly, a prism structure is determined so that it has a viewing angle of 30°. On the premise of ensuring the object resolution, we reduce the circumscribed circle diameter of the prism as much as possible and then reduce the object diameter of the entire endoscope. According to the structure of the cilia, we determine the numerical aperture of the objective lens system to provide a sufficient margin to avoid machining errors in the actual processing. According to the principle of pupil matching, the object image side, the object image side of the relay system, and the object side of the eyepiece all adopt a telecentric optical path. The relay system adopts the HOPKINS lens whose fully symmetrical structure can realize equal-proportion image transmission, and the vertical axis aberration can be automatically reduced. A piece of the negative lens can be separated to make it a thick lens, so as to solve the problem of excessive field curvature. The whole endoscope system has no visual requirement. An integrated design method of eyepiece and variable-magnification adapter systems is proposed, which can simplify the structure, reduce the cost, and better correct the aberration. In order to obtain a complete rigid endoscope optical system, it is necessary to connect all parts of the structure. Each part is connected in the order of objective lens system, relay system, eyepiece system, and variable-magnification adapter system. During the connection process, we make a simple optimization to ensure that the positions of each image plane are in the air. In addition, in order to avoid the loss of light energy, operands are still used to control the telecentricity of each image plane, and the system magnification of the connected endoscope is controlled by the image plane height. Finally, we further optimize the connected optical system and use operands to reduce field curvature and distortion, control glass thickness and air spacing, and make it machinable and assembling. MTF curve, spot diagram, and field curve distortion diagram are selected as the image quality evaluation criteria of the system to determine the optimized image quality. Tolerance analysis is carried out according to the given tolerance value to meet the performance requirements and minimize the production cost.ConclusionsAiming at the invasiveness and inaccuracy of the existing methods for evaluating nasal ciliary motion, we propose a method of direct microscopic imaging of the nasal mucosal surface through the anterior nostril for non-invasive observation and measurement of nasal ciliary movement in vivo. We use an integrated design method to design a microendoscope system with a viewing angle of 30°, high resolution, and variable magnification. The system achieves the goal of a viewing angle of 30° by secondary reflection on the viewing prism. The working wavelength is the visible light band. The working distance of the system is 3 mm, and the resolution is 272 lp/mm. The object's surface height is 0.4 mm, and the object's square aperture is 4.65 mm. In addition, the magnification is 6×-10×. We evaluate the image quality and find that the defocused spots of the three structures are smaller than the Airy disk, and the MTF curve reaches the diffraction limit. We analyze the tolerance, and the results show that it meets the processing conditions. The endoscope system is of great significance for non-invasive observation and study of nasal mucosal cilia in vivo. Results and Discussions In this paper, we propose a method for direct observation of nasal mucosa cilia by a rigid microendoscope, which can avoid the damage of cilia functions and the pain of subjects caused by sampling and greatly improve the clinical diagnostic ability of cilia-related diseases. The numerical aperture of the system is 0.15, which greatly improves the resolution ability of the system. The relay system changes the HOPKINS structure to make a negative lens separated into a thick lens to effectively correct the field curvature. The system is designed as a variable-magnification structure, which can magnify objects as required. In this paper, the integrated design of the eyepiece system and the variable-magnification adapter system, as well as that of the whole system are proposed to simplify the structure, correct the aberration to the maximum extent, and achieve the imaging quality to the diffraction limit.ObjectiveMotile cilia of nasal mucosa are widely distributed on the mucosal surface of the human respiratory tract. The defense function of removing mucus and pathogenic particles from the mucosal surface can be realized by swinging regularly in a specific direction. The normal operation of this function is important for maintaining respiratory tract health and human health. The dysfunction of cilia will lead to a series of pathological manifestations, which will seriously affect the health and quality of life of patients. The traditional ciliary motion assessment methods are invasive and cannot reflect the actual motion state of the body. In order to perform direct microscopic imaging of the nasal mucosal surface through the anterior nostril for non-invasive observation and measurement of nasal ciliary movement in vivo, we design a variable-magnification rigid microendoscope with a viewing angle of 30°. The nasal mucosal ciliary microendoscope will avoid the damage to ciliary function and the pain of subjects caused by material extraction, which thus greatly improves the clinical diagnosis ability of cilia-related diseases and becomes an important breakthrough in the scientific research and clinical work in the field of cilia.Methods The design of the optical system of the nasal mucociliary microendoscope is mainly divided into three aspectsoptical system design, image quality analysis, and tolerance analysis. The optical system mainly includes an objective lens system, relay system, eyepiece system, and variational adapter system. Firstly, a prism structure is determined so that it has a viewing angle of 30°. On the premise of ensuring the object resolution, we reduce the circumscribed circle diameter of the prism as much as possible and then reduce the object diameter of the entire endoscope. According to the structure of the cilia, we determine the numerical aperture of the objective lens system to provide a sufficient margin to avoid machining errors in the actual processing. According to the principle of pupil matching, the object image side, the object image side of the relay system, and the object side of the eyepiece all adopt a telecentric optical path. The relay system adopts the HOPKINS lens whose fully symmetrical structure can realize equal-proportion image transmission, and the vertical axis aberration can be automatically reduced. A piece of the negative lens can be separated to make it a thick lens, so as to solve the problem of excessive field curvature. The whole endoscope system has no visual requirement. An integrated design method of eyepiece and variable-magnification adapter systems is proposed, which can simplify the structure, reduce the cost, and better correct the aberration. In order to obtain a complete rigid endoscope optical system, it is necessary to connect all parts of the structure. Each part is connected in the order of objective lens system, relay system, eyepiece system, and variable-magnification adapter system. During the connection process, we make a simple optimization to ensure that the positions of each image plane are in the air. In addition, in order to avoid the loss of light energy, operands are still used to control the telecentricity of each image plane, and the system magnification of the connected endoscope is controlled by the image plane height. Finally, we further optimize the connected optical system and use operands to reduce field curvature and distortion, control glass thickness and air spacing, and make it machinable and assembling. MTF curve, spot diagram, and field curve distortion diagram are selected as the image quality evaluation criteria of the system to determine the optimized image quality. Tolerance analysis is carried out according to the given tolerance value to meet the performance requirements and minimize the production cost.ConclusionsAiming at the invasiveness and inaccuracy of the existing methods for evaluating nasal ciliary motion, we propose a method of direct microscopic imaging of the nasal mucosal surface through the anterior nostril for non-invasive observation and measurement of nasal ciliary movement in vivo. We use an integrated design method to design a microendoscope system with a viewing angle of 30°, high resolution, and variable magnification. The system achieves the goal of a viewing angle of 30° by secondary reflection on the viewing prism. The working wavelength is the visible light band. The working distance of the system is 3 mm, and the resolution is 272 lp/mm. The object's surface height is 0.4 mm, and the object's square aperture is 4.65 mm. In addition, the magnification is 6×-10×. We evaluate the image quality and find that the defocused spots of the three structures are smaller than the Airy disk, and the MTF curve reaches the diffraction limit. We analyze the tolerance, and the results show that it meets the processing conditions. The endoscope system is of great significance for non-invasive observation and study of nasal mucosal cilia in vivo.
Acta Optica Sinica
- Publication Date: Feb. 25, 2023
- Vol. 43, Issue 4, 0417001 (2023)
Topics
© Copyright 2018-2021 | Chinese Laser Press. All Rights Reserved 沪ICP备15018463号-20